
Reward your Employees For Adopting Healthier and more Productive Habits.
Healthy Employees + Happy Employees = Productive Employees

Project: MOVE App
Methods: Market research, Interviews, User flow, Wireframes, Moodboard, Competitive Analysis, Affinity Mapping, User Journey & Agile Development
Tools: Sketch, Affinity Designer & Principle
Role: UX Designer, Visual Designer & Interaction Designer
Challenge:
Across the globe, most young professionals sit a lot and barely move while working. They also find it difficult to follow an exercise routine due to their time and work restraints. We know that they value their bodies and they are seeking a way the do exercise on-the-go.
User Research


Affinity Mapping
117 people took an online survey and I interviewed 4 actively working individuals to find out more about their challenges.
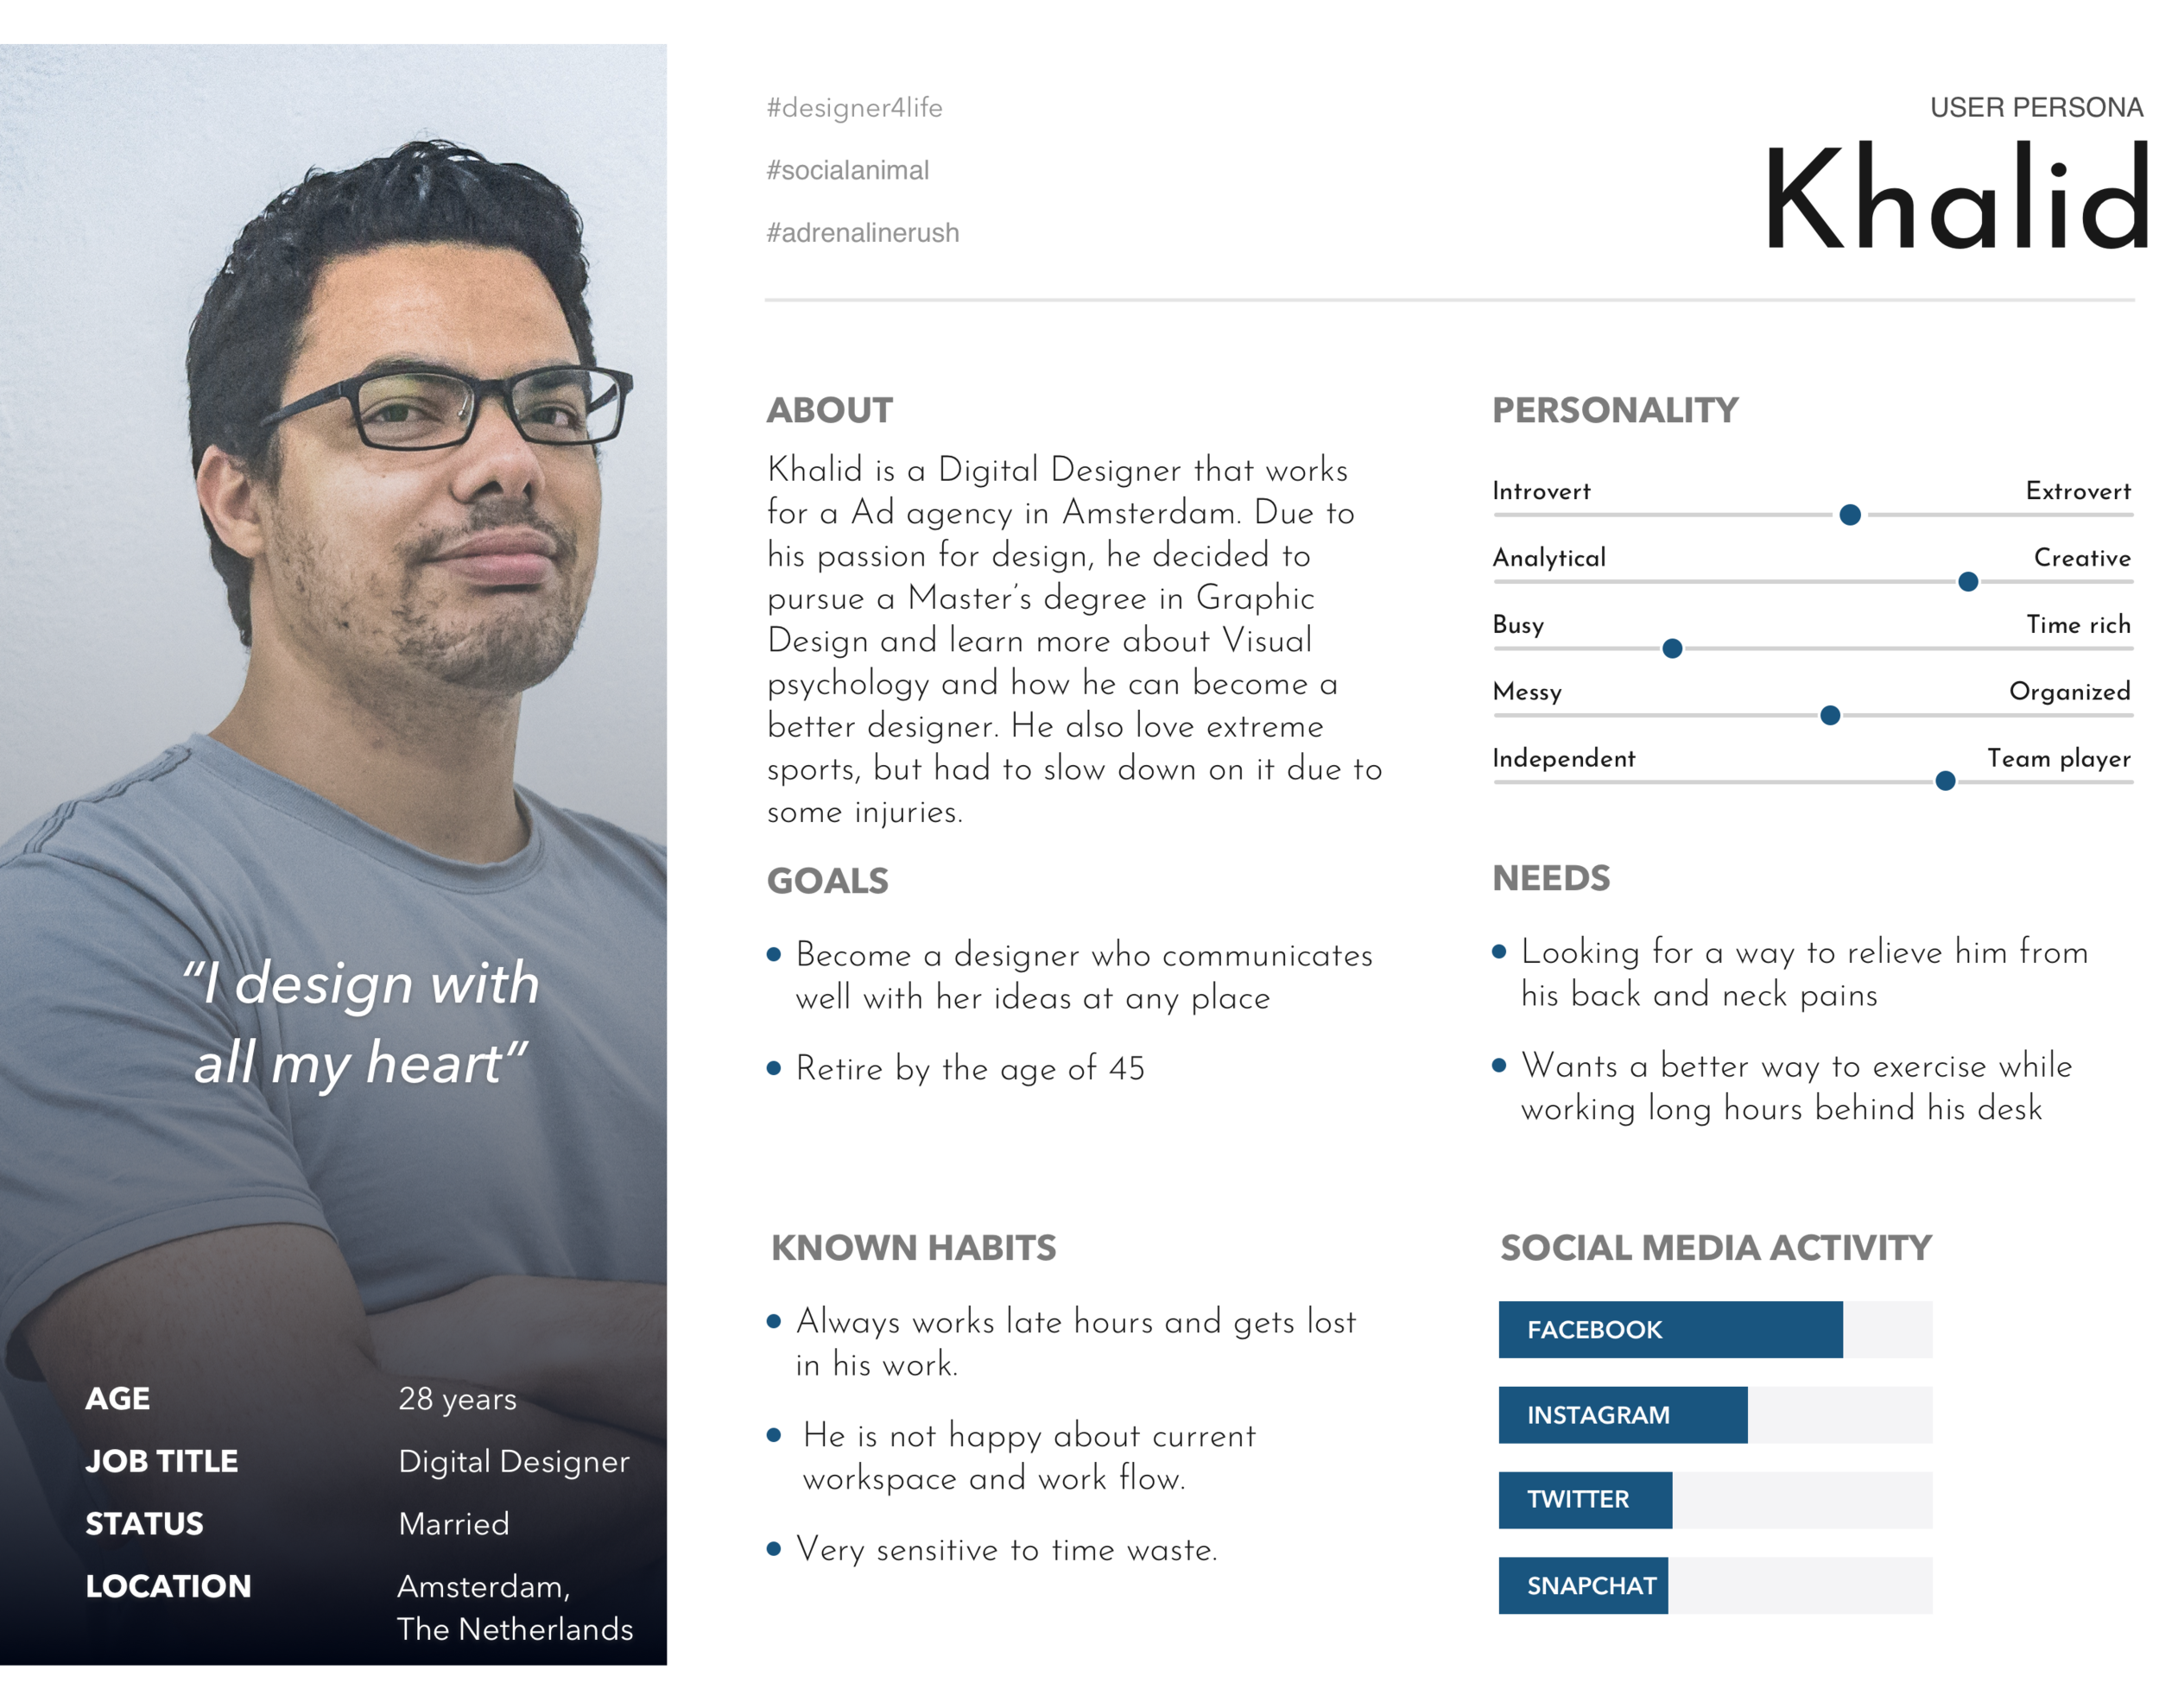
Meet Khalid, Our Persona.
He’s a Digital Designer
Problem Statement

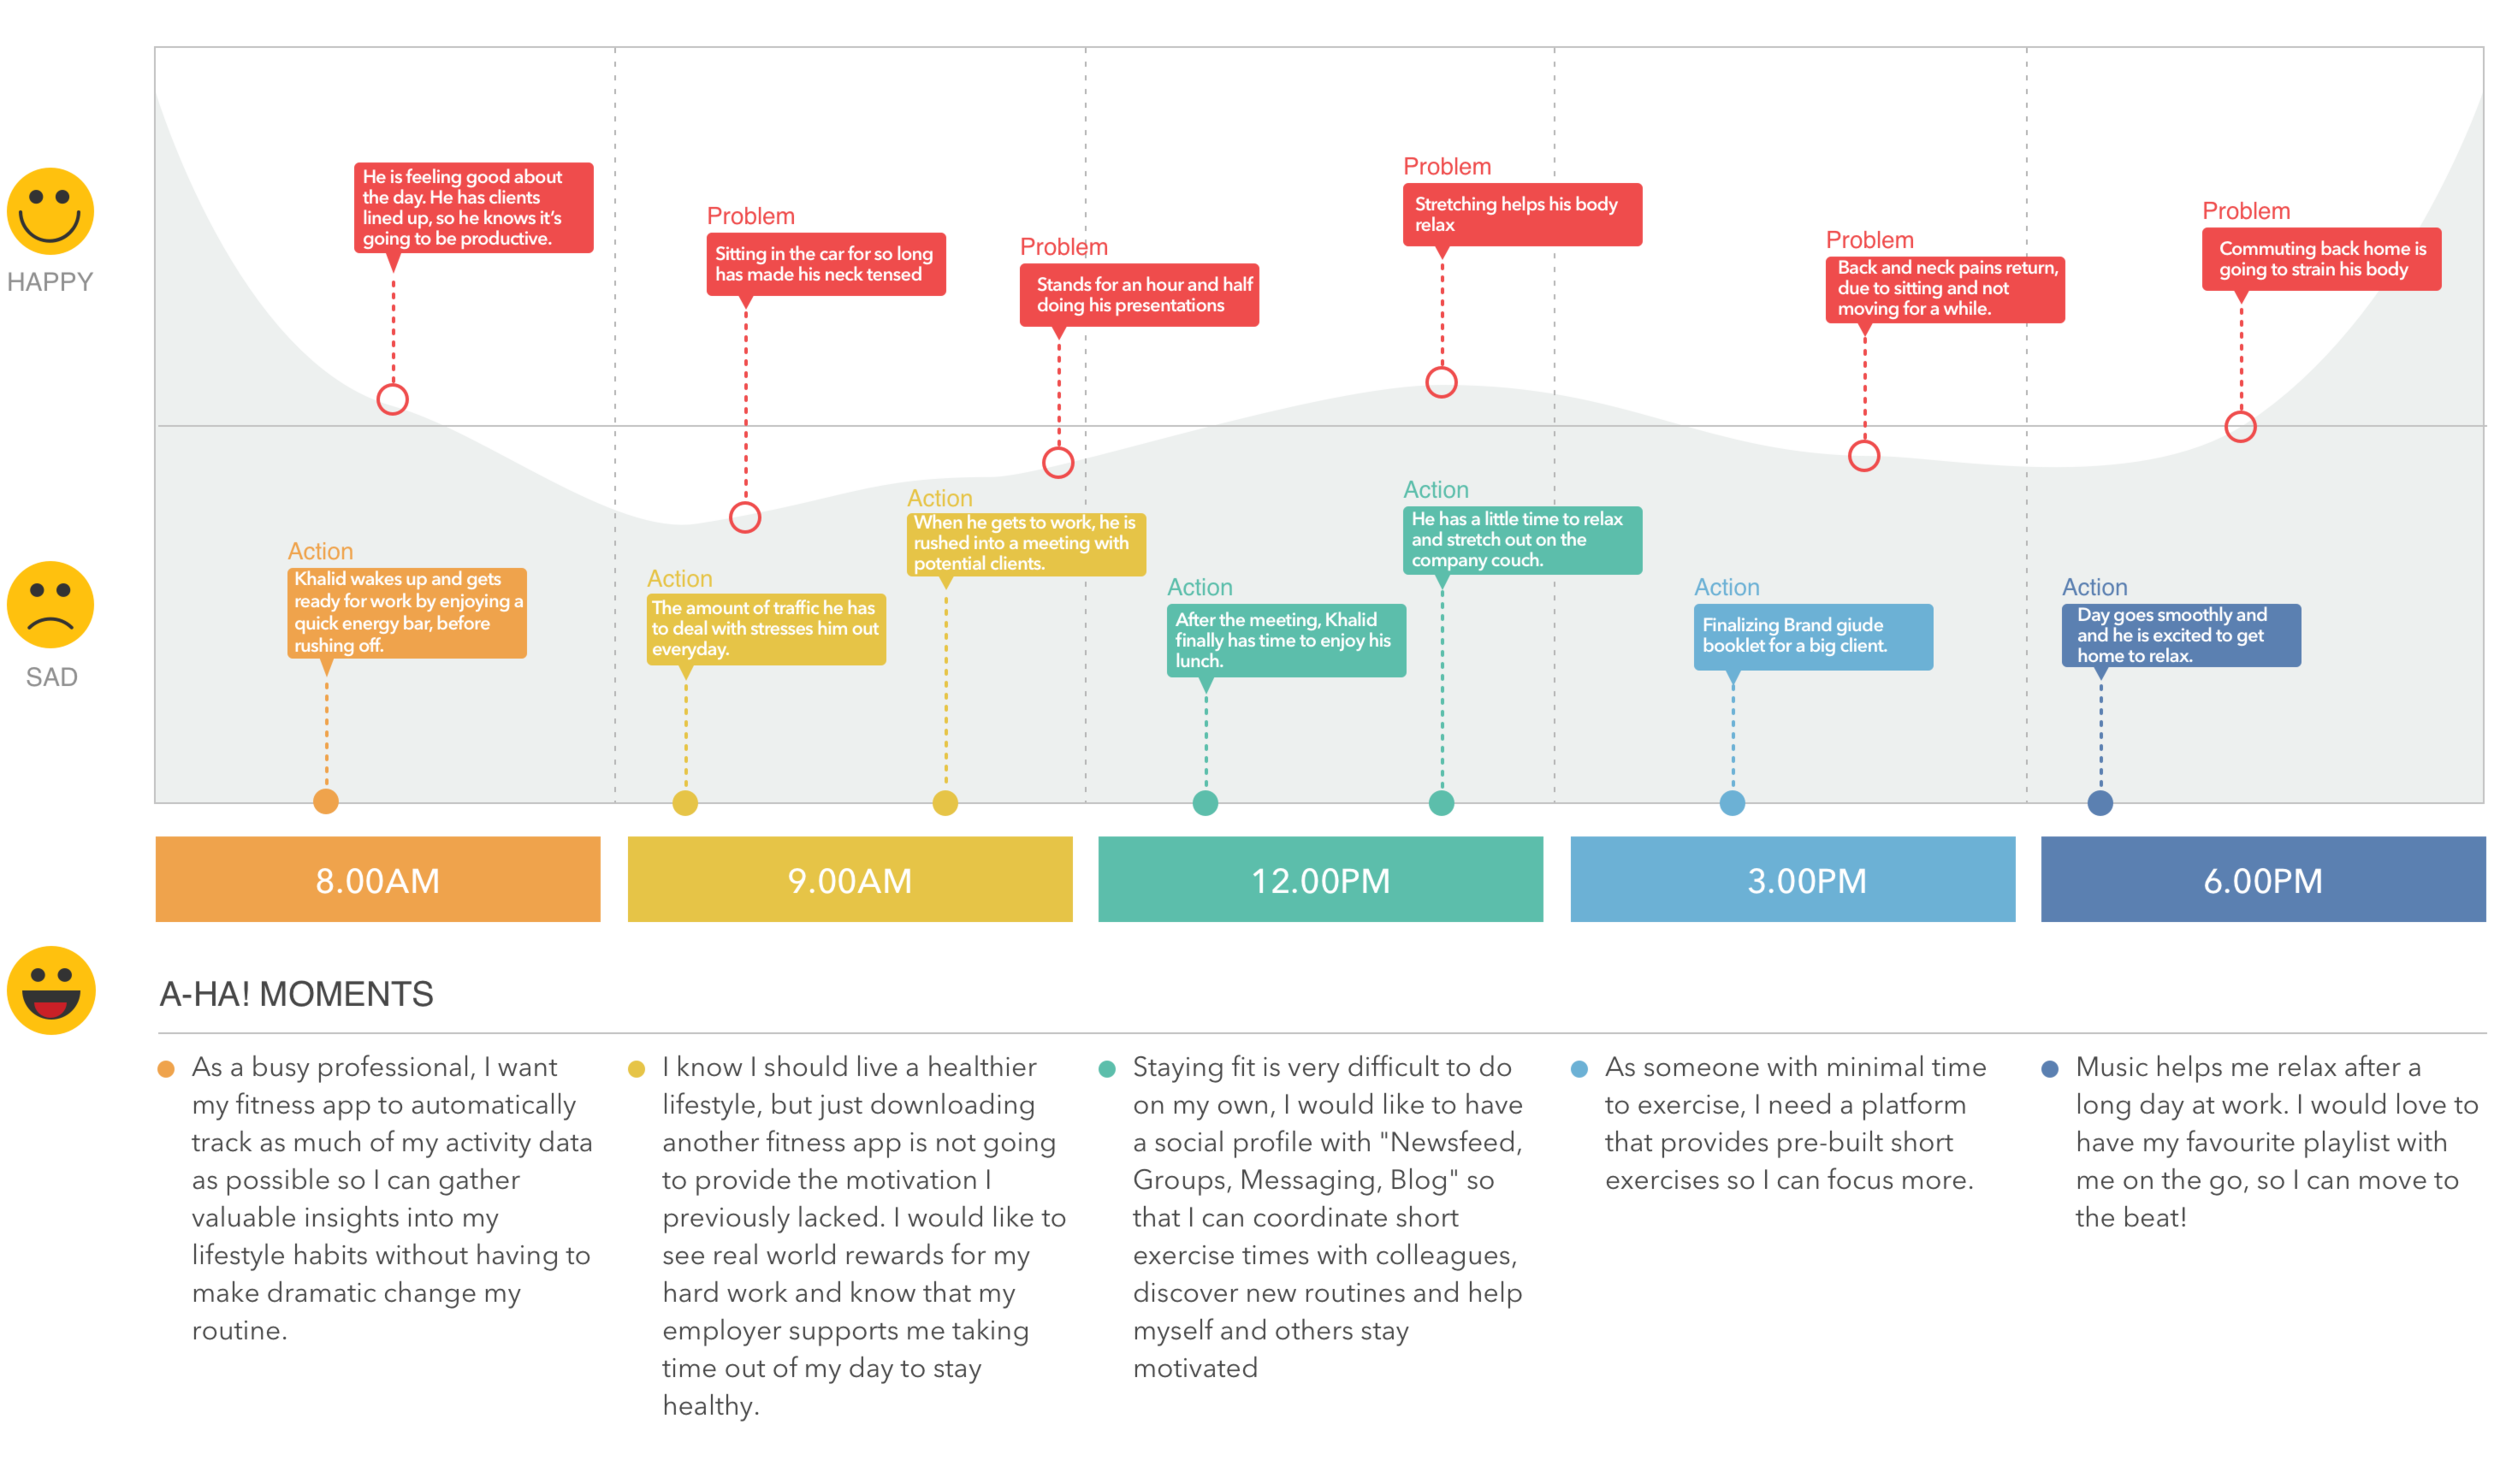
User Journey
Competitive & Comparative Analysis

Mind-Mapping
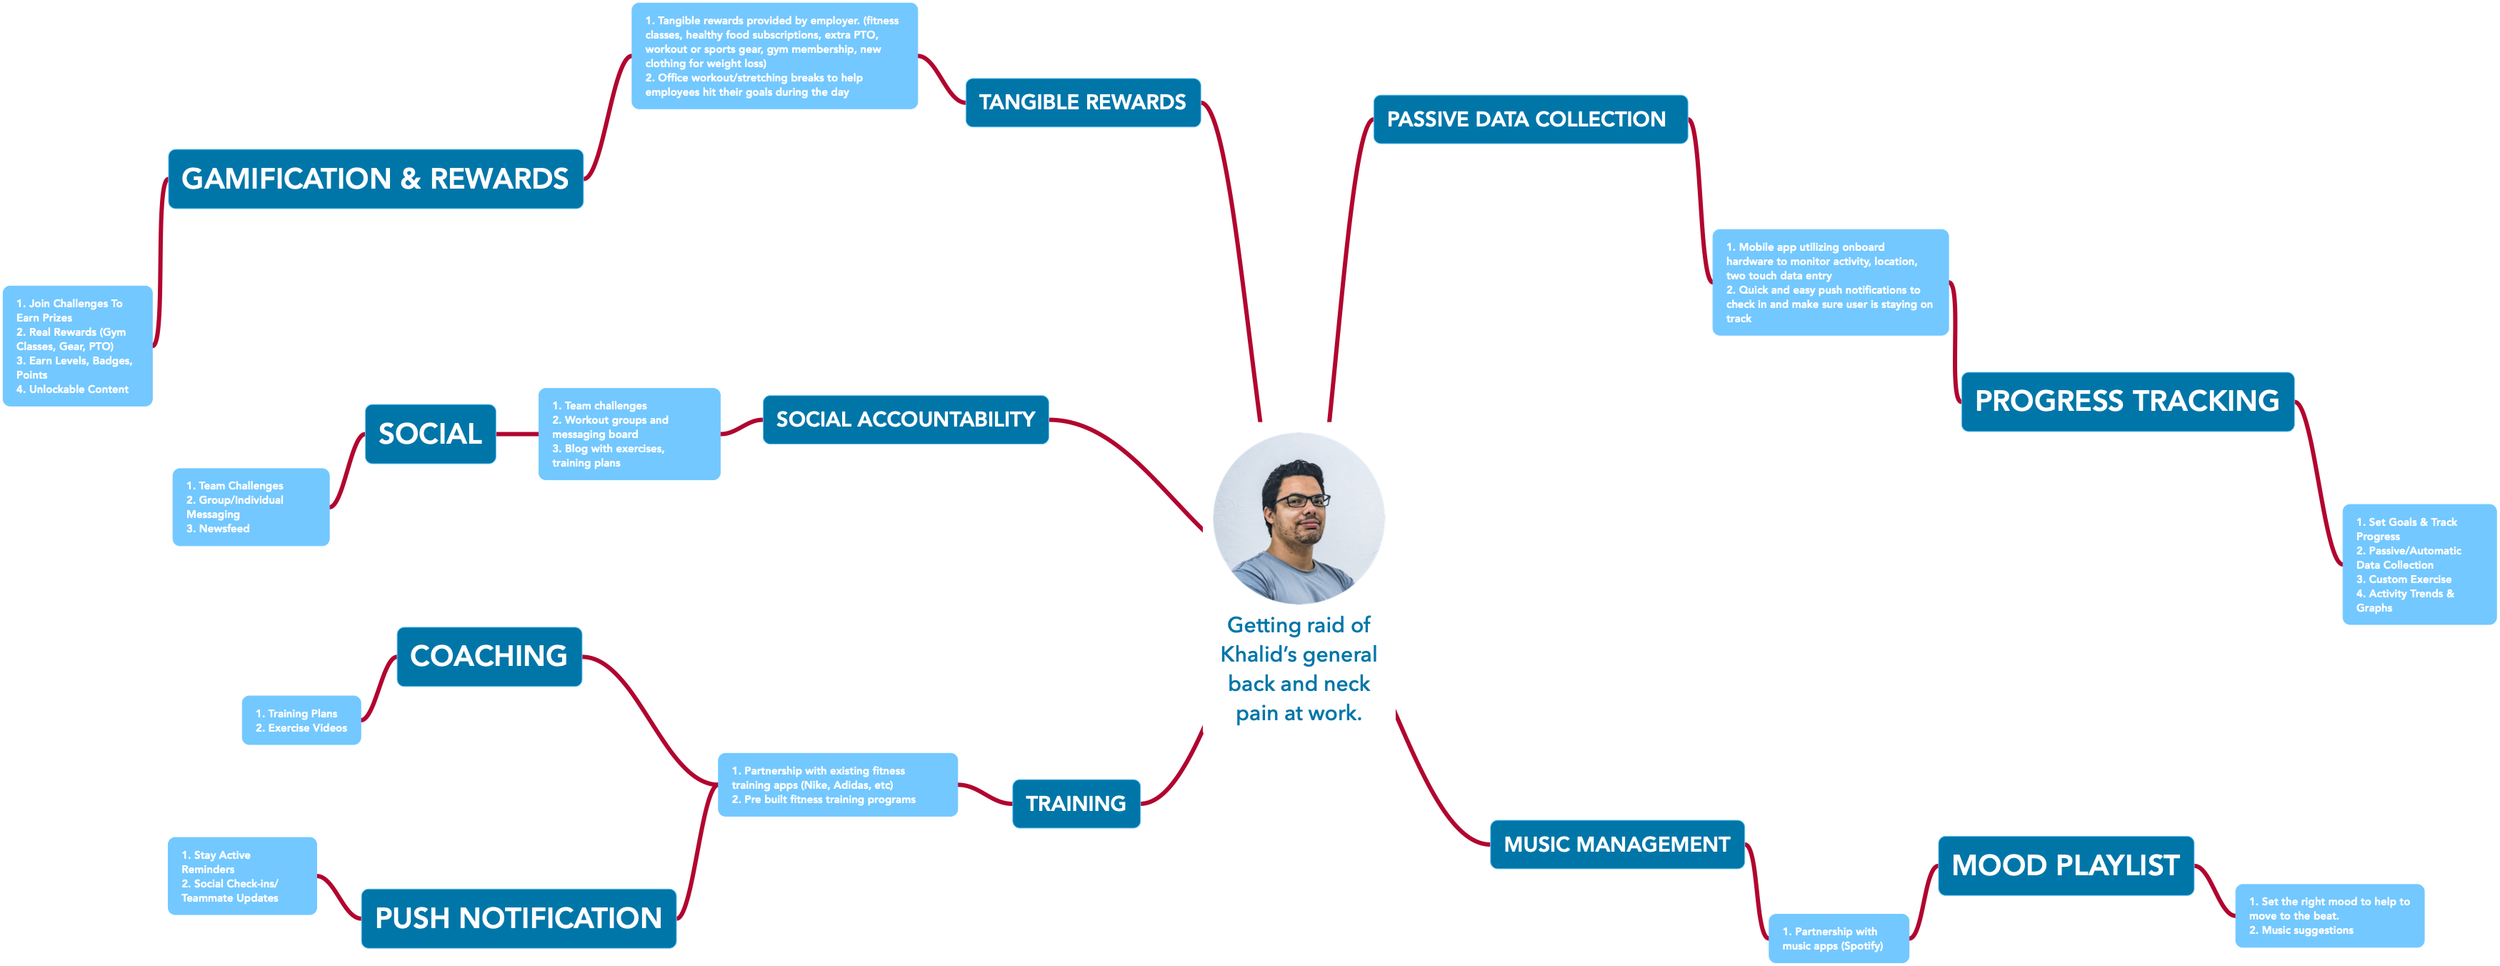
Features
PROGRESS TRACKING
Set Goals & Track Progress
Passive/Automatic Data Collection
Custom Exercise & Nutrition Entry
Activity Trends & Graphs
GAMIFICATION & REWARDS
Join Challenges To Earn Prizes
Real Rewards (Gym Classes, Gear, PTO)
Earn Levels, Badges, Points
Unlockable Content
SYNCHRONIZATION
Activity Trackers
Fitness Applications Integration
Calendar
SOCIAL
Team Challenges
Group/Individual Messaging
Newsfeed
PUSH NOTIFICATIONS
Stay Active Reminders
Healthy Snack Options
Social Check-ins/Teammate Updates
Low-Fidelity Sketches
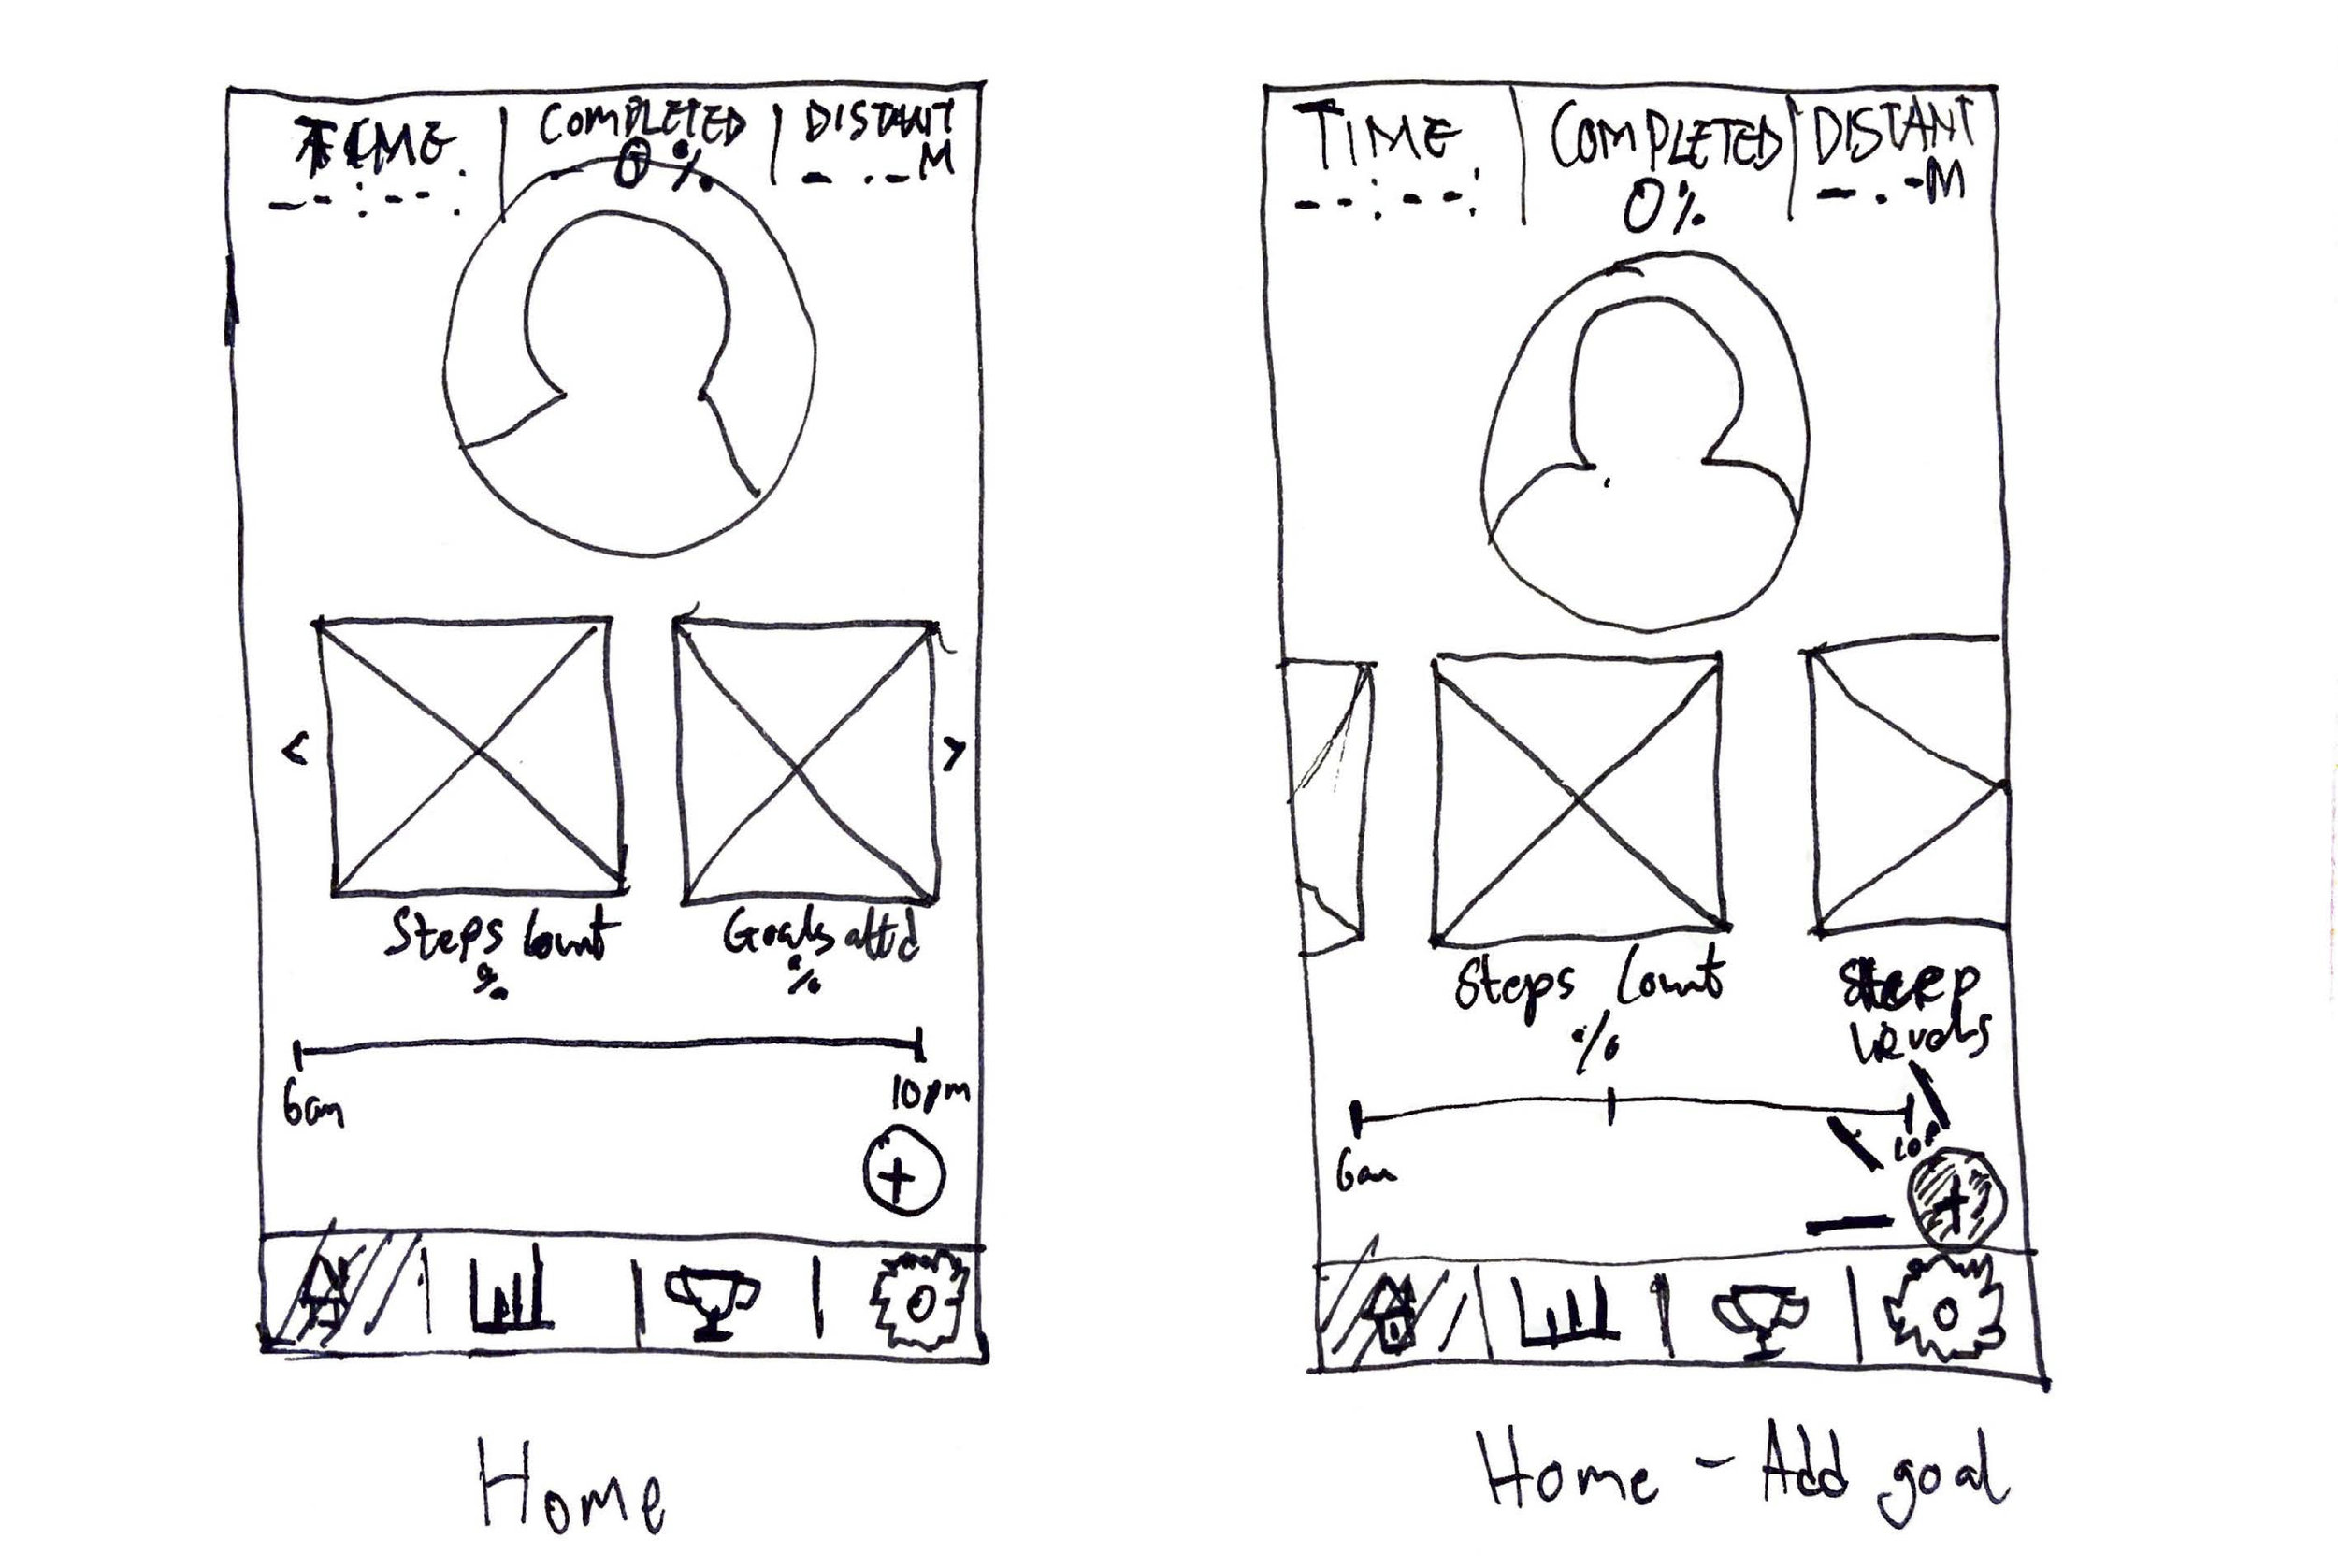
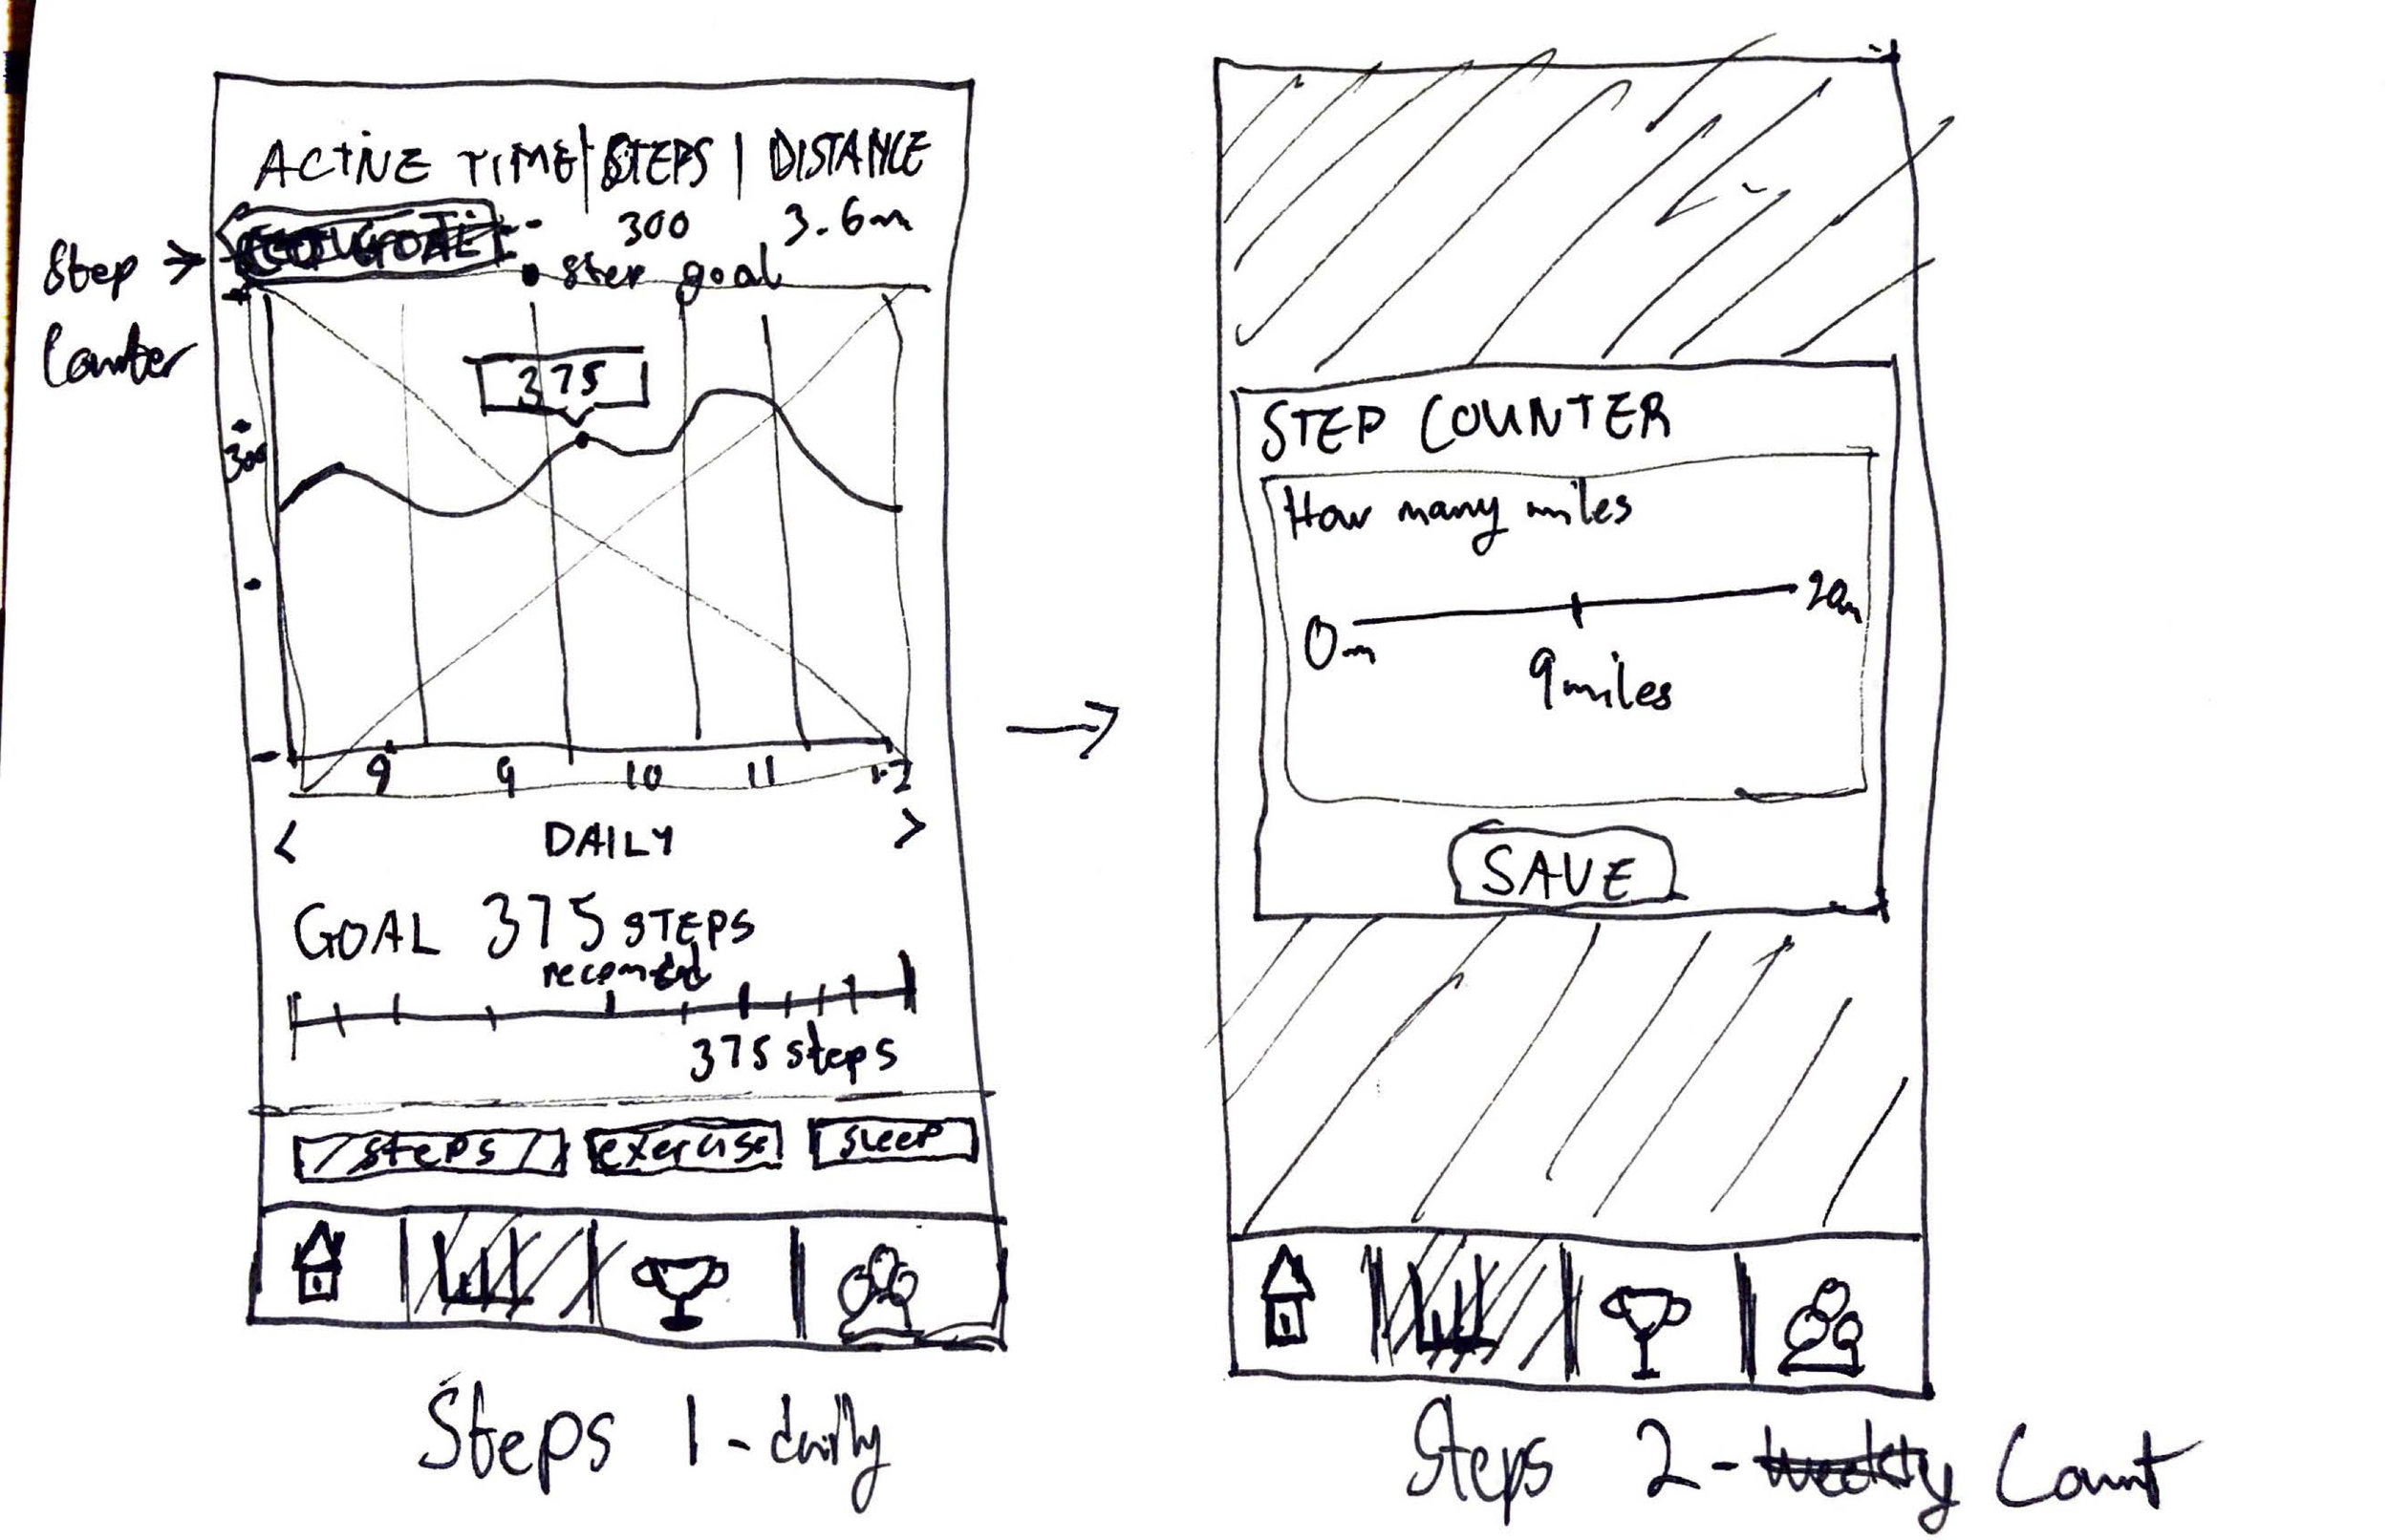
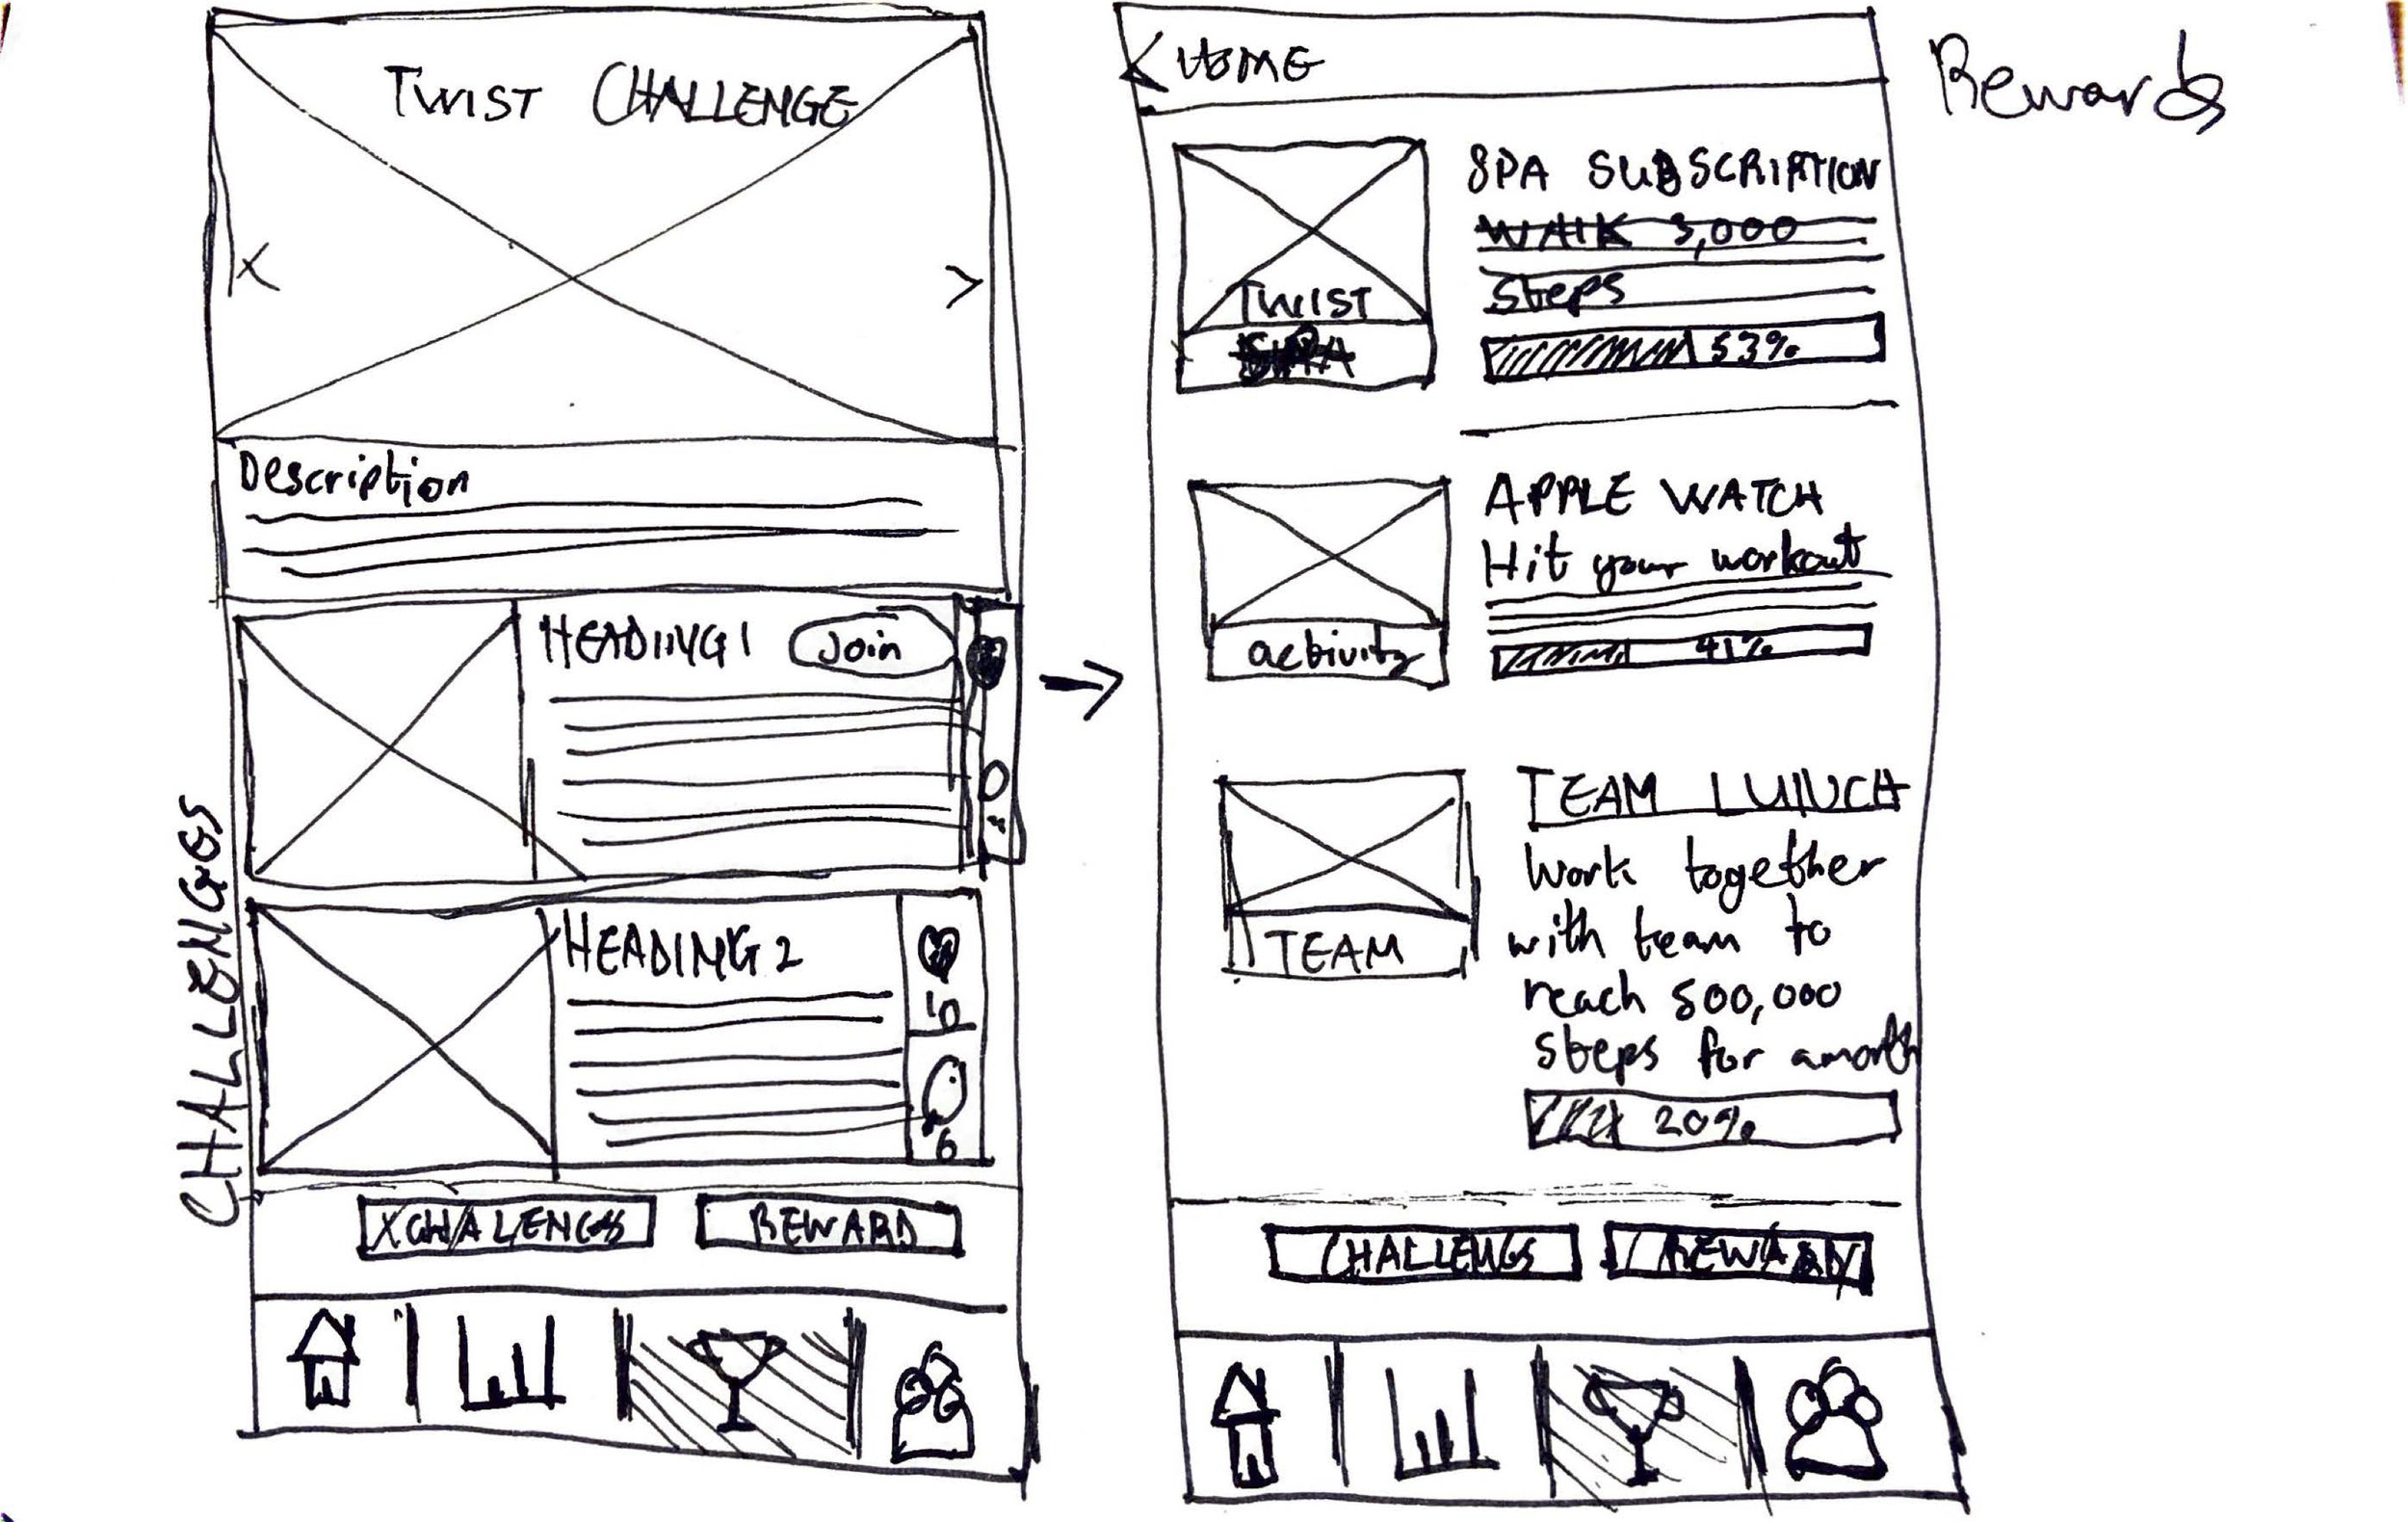


Low-Fidelity Prototype
With the low-fidelity prototype I focused more on the concept and design structure. This helped me to gather customer feedback on the sketched prototype to quickly iterate my design decisions.

User Flow

Get Moving…


High Fidelity Prototype
MOVE syncs with the onboard technology in your smartphone and wearable devices, so that you can choose which activity trackers are best suited for your needs.
It is simple for users to identify and set goals that are best suited to improve their lifestyles. Its powerful reporting and data visualization provides users with detailed summaries of their Stats, Progress Updates and Achievements.
